
安装 GDB
GDB 需要针对 riscv64 平台编译的版本才能用来调试内核,其二进制文件为 riscv64-unknown-elf-gdb。
rCore 教程的配置环境一章给了 GDB 预编译二进制的下载链接,但那是在 2020 年版本了。
最大的缺点在于不支持 TUI 插件和 dbg-dashboard。
所以,为了愉快地调试代码,需要自己编译最新的 GDB。GDB 编译流程在老教程里是有介绍的,但仍然有内容过时。
下面我记录自己的编译命令,基于 Ubuntu 系统:
1
2
3
4
5
6
7
8
9
10
11
12
13
14
15
16
17
18
19
20
21
22
23
24
25
26
27
28
29
30
31
32
33
34
35
# 1. 首先一些依赖项,其中 libncurses5-dev 提供了 TUI 库(--enable-tui 需要它)
sudo apt-get install libncurses5-dev texinfo libreadline-dev # python python-dev
# 这里的 python 和 python-dev 并不必须是 python2,我本地的默认 python 就是 3,可以编译成功并且正常使用

# 2. 检查本地 python 路径
which python # 或者 ll $(which python) 查看链接到那个 python,我的是 /usr/local/sbin/python -> /usr/bin/python3

# 3. 下载最新的 GDB 源码,清华镜像地址: https://mirrors.tuna.tsinghua.edu.cn/gnu/gdb/?C=M&O=D
wget https://mirrors.tuna.tsinghua.edu.cn/gnu/gdb/gdb-14.2.tar.xz

# 4. 解压缩它(你可以使用 tar 命令,我懒得查和记,因为我一直使用 ouch ),源码在 $PWD/gdb-14.2/ 文件夹下
ouch d gdb-14.2.tar.xz

# 5. 进入这个目录,并在里面创建另一个目录,用来存放编译结果和二进制文件
cd gdb-14.2
mkdir build-riscv64

# 适当阅读一下 gdb-14.2/gdb/README,这可是 GDB 的官方安装说明

# 6. 进入 gdb-14.4/build-riscv64 目录,准备编译
cd build-riscv64
../configure --prefix=/root/qemu/gdb-14.2/build-riscv64 --with-python=/usr/local/sbin/python --target=riscv64-unknown-elf --enable-tui=yes

# 7. 编译并生成二进制文件
make -j$(nproc)
make install

# 8. 编译好的 GDB 存放在 build-riscv64/bin/ 目录下,你可以只保留这个目录,然后添加这个目录到环境变量。
# 确认 GDB 可以运行
./bin/riscv64-unknown-elf-gdb --version
# 在 `~/.bashrc` 文件中,添加以下一行,然后开启新的终端(或者重启终端),那么
export PATH="/root/qemu/gdb-14.2/build-riscv64/bin:$PATH"

# 9. 安装 gdb-dashboard:仅仅是下载一个 python 文件到 ~/.gdbinit 来做 gdb 的启动拓展
wget -P ~ https://github.com/cyrus-and/gdb-dashboard/raw/master/.gdbinit
使用 rust-gdb
修改一下作业中 os 目录下的 Makefile 脚本(make gdb):
1
2
3
4
5
6
7
8
9
10
11
12
13
14
15
16
17
18
19
20
21
22
23
24
25
26
27
28
29
30
31
32
33
34
35
36
37
BOOTLOADER := ../bootloader/rustsbi-qemu.bin

# KERNEL ENTRY
KERNEL_ENTRY_PA := 0x80200000

TARGET := riscv64gc-unknown-none-elf
MODE := debug
BIN := os
ELF := target/$(TARGET)/$(MODE)/$(BIN)

# GDB wrapper to handle virtual path to core lib and types display in Rust
GDB_PATH := /root/qemu/gdb-14.2/build-riscv64/bin/riscv64-unknown-elf-gdb
gdb := RUST_GDB=$(GDB_PATH) rust-gdb

# Emit asm code
OBJDUMP := rust-objdump --arch-name=riscv64 --disassemble

gdb:
	@tmux new-session -d \
		"qemu-system-riscv64 -machine virt -nographic -bios $(BOOTLOADER) -device loader,file=$(ELF),addr=$(KERNEL_ENTRY_PA) -s -S" && \
		tmux split-window -h "$(gdb) -ex 'file $(ELF)' -ex 'set arch riscv:rv64' -ex 'target remote localhost:1234'" && \
		tmux swap-pane -U && \
		tmux -2 attach-session -d

kernel:
	@qemu-system-riscv64 -machine virt -nographic -bios $(BOOTLOADER) -device loader,file=$(ELF),addr=$(KERNEL_ENTRY_PA)

disasm:
	@$(OBJDUMP) $(ELF) | bat -l asm

gdbserver:
	@qemu-system-riscv64 -machine virt -nographic -bios $(BOOTLOADER) -device loader,file=$(ELF),addr=$(KERNEL_ENTRY_PA) -s -S

gdbclient:
	@$(gdb) -ex 'file $(ELF)' -ex 'set arch riscv:rv64' -ex 'target remote localhost:1234'

.PHONY: gdb disasm gdbserver gdbclient kernel
注意:os ELF 文件中包含 /rustc/hash 开头的虚拟路径,需要 rust-gdb 来帮助 GDB 识别。而 rust-gdb 直接调用 gdb 命令,如果你本地的 riscv64-unknown-elf-gdb 不符号链接成 gdb,那么可以使用 RUST_GDB 环境变量来指定它的路径。 rust-gdb 还可以更好地显示 Rust 的类型,所以这对于 rCore 是必须的:)
 rust-gdb
 无 rust-gdb
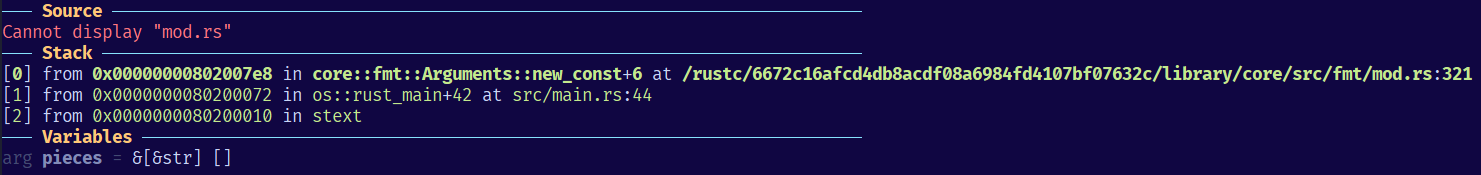
如果你看到 GDB 无法找到源码,那么需要检查在哪里丢弃的符号,包括但不限于
- cargo 编译选项是 debug 还是 release
- 调试版本尽量选择 debug
- 虽然在 release profile 中,也可以配置成
strip = false来避免去除符号和源码路径,但优化会导致指令与实际代码对应不上
linker.ld脚本把 debug 段丢弃了(/DISCARD/ { *(.debug*) })objdump传递了 strip 参数
丢弃符号通常只是为了减小二进制的体积。但对于开发来说,没有符号和源码路径就意味着无法调试。那么如何知道符号完整呢?
cargo nm -- -l可以罗列 ELF 文件内的符号及其源码路径(该命令来自cargo-binutils,已经在 rCore 环境配置安装了)- GDB 命令
info functions可以罗列或者筛选符号
比如对于 discard 了 debug 段的 linker.ld,cargo nm --bin hello -- -l 查看一个 ELF,符号的源码路径被替换了
1
2
3
4
5
6
7
8
9
10
11
12
13
14
15
16
17
00000000806001ce t core::fmt::Arguments::new_v1::h741c19aff15e0fbc      3f7tq8l5guw80ras:0
...
0000000080600ef0 t core::fmt::Formatter::pad_integral::write_prefix::hb49bd2387561b763  core.33f7ee81a6b78e39-cgu.0:0
...
0000000080600154 T user_lib::exit::h4061419aa5f7b4c2
000000008060013c T user_lib::write::h5d49bbdc9aa408de
0000000080600480 T user_lib::console::print::h5cc98a09cc243fc5
0000000080600168 t user_lib::syscall::syscall::he49ce1904c1bcccf        3eg2fvct9z14yo4c:0
00000000806001aa t user_lib::syscall::sys_exit::h4a9cfe4324c7eae4       3eg2fvct9z14yo4c:0
0000000080600182 t user_lib::syscall::sys_write::h68b8e5bcf011de72      3eg2fvct9z14yo4c:0
00000000806000dc T user_lib::clear_bss::hde0b07a7b88782c7
00000000806003b2 T <core::slice::iter::IterMut<T> as core::iter::traits::iterator::Iterator>::next::h97941033b59dc358
0000000080600000 T _start
00000000806031c0 B end_bss
0000000080600044 T main
000000008060084a T rust_begin_unwind
00000000806031c0 B start_bss
通过删除或者注释,把 .debug 段保留:
1
2
3
4
5
6
7
SECTIONS
{
    /DISCARD/ : {
        *(.eh_frame)
        /* *(.debug*) */
    }
}
然后重新编译(注意,由于 cargo 似乎不会因为修改 ld 文件来触发重新编译,所以修改一下相应的 rs 文件来编译,或者清理 target 目录来编译),就可以看到符号的源码路径完整:
1
2
3
4
5
6
7
8
9
10
11
12
13
14
15
16
17
18
000000008060072a t core::fmt::Arguments::new_v1::h741c19aff15e0fbc      /rustc/6672c16afcd4db8acdf08a6984fd4107bf07632c/library/core/src/fmt/mod.rs:331
...
0000000080600e84 t core::fmt::Formatter::pad_integral::write_prefix::hb49bd2387561b763  /rustc/6672c16afcd4db8acdf08a6984fd4107bf07632c/library/core/src/fmt/mod.rs:1293
...
0000000080600154 T user_lib::exit::h4061419aa5f7b4c2    /root/qemu/user/src/lib.rs:60
000000008060013c T user_lib::write::h5d49bbdc9aa408de   /root/qemu/user/src/lib.rs:56
0000000080600480 T user_lib::console::print::h5cc98a09cc243fc5  /root/qemu/user/src/console.rs:14
0000000080600168 t user_lib::syscall::syscall::he49ce1904c1bcccf        /root/qemu/user/src/syscall.rs:3
00000000806001aa t user_lib::syscall::sys_exit::h4a9cfe4324c7eae4       /root/qemu/user/src/syscall.rs:24
0000000080600182 t user_lib::syscall::sys_write::h68b8e5bcf011de72      /root/qemu/user/src/syscall.rs:20
00000000806000dc T user_lib::clear_bss::hde0b07a7b88782c7       /root/qemu/user/src/lib.rs:36
00000000806003b2 T <core::slice::iter::IterMut<T> as core::iter::traits::iterator::Iterator>::next::h97941033b59dc358   /rustc/6672c16afcd4db8acdf08a6984fd4107bf07632c/libr
ary/core/src/slice/iter/macros.rs:156
0000000080600000 T _start       /root/qemu/user/src/lib.rs:30
00000000806031c0 B end_bss
0000000080600044 T main /root/qemu/user/src/bin/hello.rs:13
000000008060084a T rust_begin_unwind    /root/qemu/user/src/lang_items.rs:4
00000000806031c0 B start_bss
GDB - tui 命令
首先,由于上述自编译的 GDB 已经自身具有 TUI 模式,所以自己查看说明 help tui:
1
2
3
4
5
6
7
8
9
10
11
12
13
14
15
16
17
18
19
20
21
22
23
24
25
26
27
28
29
tui disable -- Disable TUI display mode.
tui enable -- Enable TUI display mode.
tui focus, fs, focus -- Set focus to named window or next/prev window.
tui layout, layout -- Change the layout of windows.
tui new-layout -- Create a new TUI layout.
tui refresh, refresh -- Refresh the terminal display.
tui reg -- TUI command to control the register window.
tui window -- Text User Interface window commands.
回到原 tui 模式(区别于 gdb-dashboard)
>>> tui refresh
退出 tui 模式
>>> tui disable
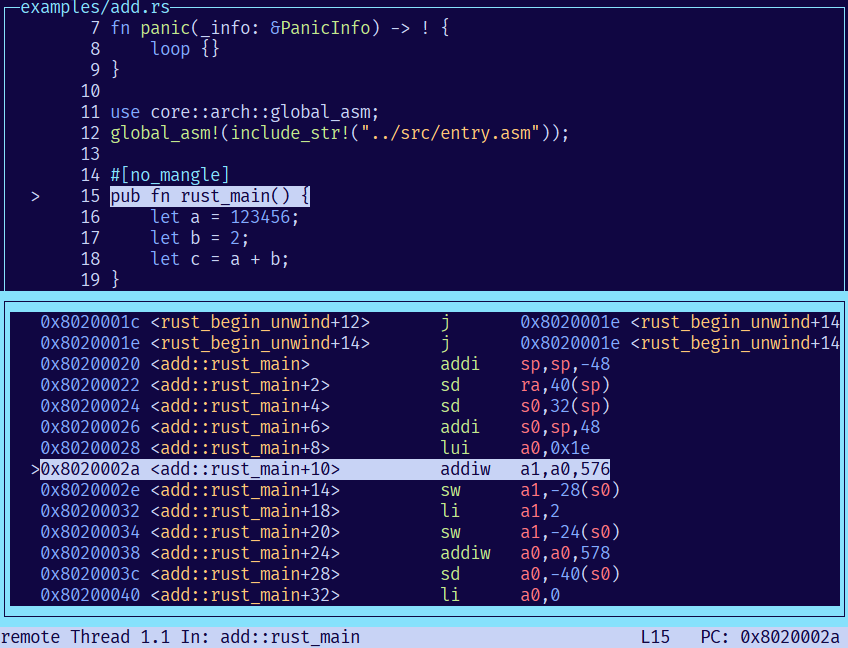
调整上方显示的内容:汇编指令(asm)、源代码 (src)、寄存器 (regs) 以及将它们放在哪里 (split/prev/next)
tui layout asm -- Apply the "asm" layout.
tui layout next -- Apply the next TUI layout.
tui layout prev -- Apply the previous TUI layout.
tui layout regs -- Apply the TUI register layout.
tui layout split -- Apply the "split" layout.
tui layout src -- Apply the "src" layout.
比如进入原 tui 模式会把窗口分割成两个区域:源码和命令
tui layout next 可以把源码区域换成下一个面板(asm)
tui layout split 可以从上方的源码区域切割一个区域,然后拥有了 src、asm 以及命令三个框
此时上下方向键会联动 src 和 asm 来展示内容,但这无法再用它们输入上/下一个历史命令
因此需要 Ctrl-p 和 Ctrl-n 再命令框输入上/下一个历史命令
原 tui 模式非常方便来查看当前指令所在的完整的 src/asm 上下文。
GDB - dashboard 命令
安装了上述 dashboard 插件,则可以使用 dashboard 命令,使用 help dashboard 查看详细信息:
1
2
3
4
5
6
7
8
9
10
11
12
13
14
15
dashboard -configuration -- Dump or save the dashboard configuration.
dashboard -enabled -- Enable or disable the dashboard.
dashboard -layout -- Set or show the dashboard layout.
dashboard -output -- Set the output file/TTY for the whole dashboard or single modules.
dashboard -style -- Access the stylable attributes.
dashboard assembly -- Configure the assembly module, with no arguments toggles its visibility.
dashboard breakpoints -- Configure the breakpoints module, with no arguments toggles its visibility.
dashboard expressions -- Configure the expressions module, with no arguments toggles its visibility.
dashboard history -- Configure the history module, with no arguments toggles its visibility.
dashboard memory -- Configure the memory module, with no arguments toggles its visibility.
dashboard registers -- Configure the registers module, with no arguments toggles its visibility.
dashboard source -- Configure the source module, with no arguments toggles its visibility.
dashboard stack -- Configure the stack module, with no arguments toggles its visibility.
dashboard threads -- Configure the threads module, with no arguments toggles its visibility.
dashboard variables -- Configure the variables module, with no arguments toggles its visibility.
GDB 似乎会在命令没有歧义的时候支持短命令,所以 da 或者 dash 与 dashboard 等价。一些命令解释:
dashboard:dashboard 不会固定高度,所以你输入的命令会把 dashboard 挤压掉,所以需要这个命令让 dashboard 位置复原dashboard history(或者把 history 换成类似的区域名称):显示/隐藏 那个区域dashboard -layout assembly source:只显示 assembly 和 source 区域dashboard -layout assembly breakpoints expressions !history memory registers source stack !threads variables: 在不需要的区域前写!来排除掉那些区域,比如排除掉 history 和 threadsdash -layout !:恢复默认的布局,显示所有区域
dashboard -configuration ~/.gdbinit.d/init:可将将当前所显示的布局保存到配置文件,下次开启 GDB 只会显示它们。 需要手动创建~/.gdbinit.d目录。通常修改区域之后,使用这一步来永久化- 搭配 tui 命令:
- dashboard 可以同时观察到不同角度的调试信息,但如果想单独查看源码的上下文,可以使用
tui focus src来专注于查看当前源码的上下文,在那里上下方向键和翻页键直接控制源码页面,然后tui disable回到 dashboard。
- dashboard 可以同时观察到不同角度的调试信息,但如果想单独查看源码的上下文,可以使用
GDB - info 命令
1
2
3
4
5
6
7
8
9
10
11
12
13
14
15
16
17
18
19
20
21
22
23
24
25
26
27
28
29
30
31
32
33
34
35
36
37
38
39
40
41
42
43
44
45
46
47
48
49
50
51
52
53
54
55
56
57
58
59
60
61
62
63
64
65
66
67
68
69
70
71
72
>>> help info
info, inf, i
Generic command for showing things about the program being debugged.

List of info subcommands:

info address -- Describe where symbol SYM is stored.
info all-registers -- List of all registers and their contents, for selected stack frame.
info args -- All argument variables of current stack frame or those matching REGEXPs.
info auto-load -- Print current status of auto-loaded files.
info auxv -- Display the inferior's auxiliary vector.
info bookmarks -- Status of user-settable bookmarks.
info breakpoints,
   info b -- Status of specified breakpoints (all user-settable breakpoints if no argument).
info classes -- All Objective-C classes, or those matching REGEXP.
info common -- Print out the values contained in a Fortran COMMON block.
info connections -- Target connections in use.
info copying -- Conditions for redistributing copies of GDB.
info dcache -- Print information on the dcache performance.
info display -- Expressions to display when program stops, with code numbers.
info exceptions -- List all Ada exception names.
info extensions -- All filename extensions associated with a source language.
info files -- Names of targets and files being debugged.
info float -- Print the status of the floating point unit.
info frame, info f -- All about the selected stack frame.
info frame-filter -- List all registered Python frame-filters.
info functions -- All function names or those matching REGEXPs.
info guile, info gu -- Prefix command for Guile info displays.
info inferiors -- Print a list of inferiors being managed.
info line -- Core addresses of the code for a source line.
info locals -- All local variables of current stack frame or those matching REGEXPs.
info macro -- Show the definition of MACRO, and it's source location.
info macros -- Show the definitions of all macros at LINESPEC, or the current source location.
info main -- Get main symbol to identify entry point into program.
info mem -- Memory region attributes.
info module -- Print information about modules.
info modules -- All module names, or those matching REGEXP.
info os -- Show OS data ARG.
info pretty-printer -- GDB command to list all registered pretty-printers.
info probes -- Show available static probes.
info proc -- Show additional information about a process.
info program -- Execution status of the program.
info record, info rec -- Info record options.
info registers,
   info r -- List of integer registers and their contents, for selected stack frame.
info scope -- List the variables local to a scope.
info selectors -- All Objective-C selectors, or those matching REGEXP.
info sharedlibrary, info dll -- Status of loaded shared object libraries.
info signals, info handle -- What debugger does when program gets various signals.
info skip -- Display the status of skips.
info source -- Information about the current source file.
info sources -- All source files in the program or those matching REGEXP.
info stack, info s -- Backtrace of the stack, or innermost COUNT frames.
info static-tracepoint-markers -- List target static tracepoints markers.
info symbol -- Describe what symbol is at location ADDR.
info target -- Names of targets and files being debugged.
info tasks -- Provide information about all known Ada tasks.
info terminal -- Print inferior's saved terminal status.
info threads -- Display currently known threads.
info tracepoints,
   info tp -- Status of specified tracepoints (all tracepoints if no argument).
info tvariables -- Status of trace state variables and their values.
info type-printers -- GDB command to list all registered type-printers.
info types -- All type names, or those matching REGEXP.
info unwinder -- GDB command to list unwinders.
info variables -- All global and static variable names or those matching REGEXPs.
info vector -- Print the status of the vector unit.
info vtbl -- Show the virtual function table for a C++ object.
info warranty -- Various kinds of warranty you do not have.
info watchpoints -- Status of specified watchpoints (all watchpoints if no argument).
info win -- List of all displayed windows.
info xmethod -- GDB command to list registered xmethod matchers.
info functions 命令
使用 info functions 可以查看被定义的函数符号,比如对 Rust 来说:
1
2
3
4
5
6
7
8
9
10
11
12
13
14
15
16
17
18
19
20
21
22
>>> info functions
All defined functions:

... 此处省略展示的源码路径和行号预览

Non-debugging symbols:
0x0000000080200000  _start
0x0000000080200000  skernel
0x0000000080200000  stext
0x0000000080200010  <&T as core::fmt::Display>::fmt
0x0000000080200032  <&T as core::fmt::Display>::fmt
0x000000008020004a  core::fmt::Write::write_char
0x0000000080200178  core::fmt::Write::write_fmt
0x000000008020019c  core::ptr::drop_in_place<core::fmt::Error>
0x00000000802001ac  <core::fmt::Error as core::fmt::Debug>::fmt
0x00000000802001d0  <os::console::Stdout as core::fmt::Write>::write_str
0x000000008020025a  os::console::print
0x00000000802002aa  rust_begin_unwind
0x0000000080200354  os::sbi::shutdown
0x00000000802003a0  rust_main
0x0000000080201000  etext
0x0000000080201000  srodata
这里的重点在于 Non-debugging symbols,你可以用两种相同的方式使用它们,以 rust_main 为例, b *0x00000000802003a0 和 b rust_main 都可以用来给同一处函数入口位置打上断点。对于 Rust 中的 trait 实现,像 b <os::console::Stdout as core::fmt::Write>::write_str 这样包含尖括号和空格的函数路径是合法的命令。
该命令还支持正则搜索函数路径,比如 info functions console 列出函数路径中包含 console 的函数:
1
2
3
4
5
6
7
8
9
10
11
12
13
14
15
16
17
18
19
20
>>> info functions console
All functions matching regular expression "console":

File /root/.cargo/registry/src/rsproxy.cn-0dccff568467c15b/sbi-rt-0.0.2/src/legacy.rs:
22:     static fn sbi_rt::legacy::console_putchar(usize) -> usize;

File /rustc/6672c16afcd4db8acdf08a6984fd4107bf07632c/library/core/src/fmt/mod.rs:
166:    static fn core::fmt::Write::write_char<os::console::Stdout>(*mut os::console::Stdout, char) -> core::result::Result<(), core::fmt::Error>;
210:    static fn core::fmt::Write::write_fmt::{impl#1}::spec_write_fmt<os::console::Stdout>(*mut os::console::Stdout, core::fmt::Arguments) -> core::result::Result<(), core::fmt::Error>;
194:    static fn core::fmt::Write::write_fmt<os::console::Stdout>(*mut os::console::Stdout, core::fmt::Arguments) -> core::result::Result<(), core::fmt::Error>;

File /rustc/6672c16afcd4db8acdf08a6984fd4107bf07632c/library/core/src/ptr/mod.rs:
509:    static fn core::ptr::drop_in_place<os::console::Stdout>(*mut os::console::Stdout);

File src/console.rs:
15:     static fn os::console::print(core::fmt::Arguments);
7:      static fn os::console::{impl#0}::write_str(*mut os::console::Stdout, &str) -> core::result::Result<(), core::fmt::Error>;

File src/sbi.rs:
2:      static fn os::sbi::console_putchar(usize);
这对于快速定位到待打断点的特定目录或函数名特别方便,因为它提供了源码路径和行号,以及函数签名,从而又为 trait functions 添加了一种方式来打断点。
至此,比如给 os::console::Stdout 的 write_str 方法打断点,以下 4 种方式等价:
b src/console.rs:7b os::console::{impl#0}::write_strb <os::console::Stdout as core::fmt::Write>::write_strb 0x00000000802001d0
由于支持正则表达式,所以 info functions console.*write 可以直接定位到 src/console.rs:7:
1
2
3
4
5
>>> info functions console.*write
All functions matching regular expression "console.*write":

File src/console.rs:
7:      static fn os::console::{impl#0}::write_str(*mut os::console::Stdout, &str) -> core::result::Result<(), core::fmt::Error>;
info locals 命令
1
2
3
4
5
6
7
8
9
10
11
12
13
14
15
16
17
18
19
20
21
22
23
24
25
26
27
28
29
30
31
32
33
34
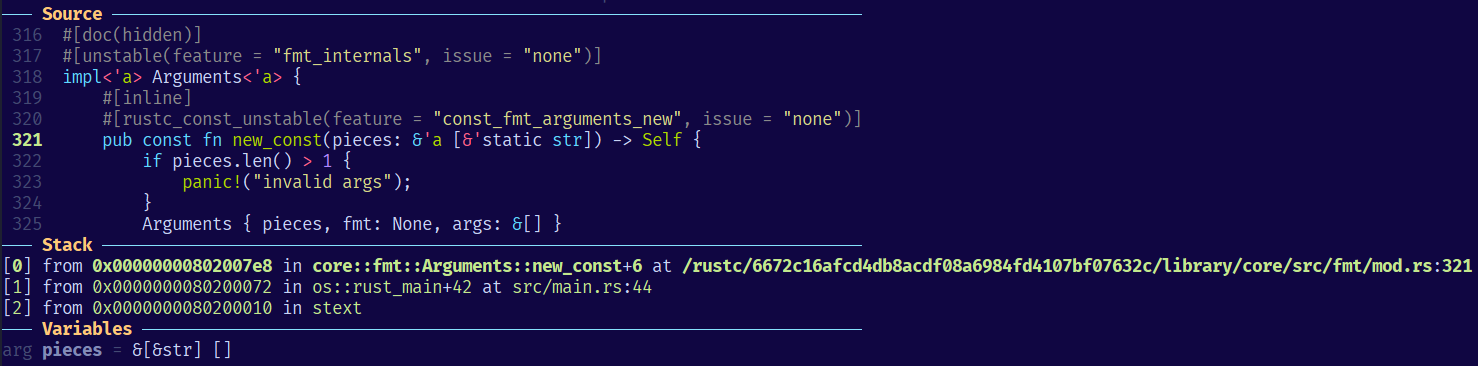
─── Source ─────────────────────────────────────────────────────────────────────────────────────────────────────────────────────────────────────────────────────────────────
4 struct Stdout;
5
6 impl Write for Stdout {
7 fn write_str(&mut self, s: &str) -> fmt::Result {
! 8 for c in s.chars() {
9 console_putchar(c as usize);
10 }
11 Ok(())
12 }
13 }
─── Stack ──────────────────────────────────────────────────────────────────────────────────────────────────────────────────────────────────────────────────────────────────
[0] from 0x0000000080200f30 in os::console::{impl#0}::write_str+122 at src/console.rs:9
[1] from 0x000000008020143a in core::fmt::write+374 at library/core/src/fmt/mod.rs:1144
[2] from 0x000000008020115c in core::fmt::Write::write_fmt::{impl#1}::spec_write_fmt<os::console::Stdout>+30 at /rustc/6672c16afcd4db8acdf08a6984fd4107bf07632c/library/core/src/fmt/mod.rs:211
[3] from 0x0000000080201136 in core::fmt::Write::write_fmt<os::console::Stdout>+20 at /rustc/6672c16afcd4db8acdf08a6984fd4107bf07632c/library/core/src/fmt/mod.rs:215
[4] from 0x0000000080200f76 in os::console::print+60 at src/console.rs:16
[5] from 0x000000008020007e in os::rust_main+54 at src/main.rs:44
[6] from 0x0000000080200010 in stext
─── Variables ──────────────────────────────────────────────────────────────────────────────────────────────────────────────────────────────────────────────────────────────
arg self = 0x80213f67: os::console::Stdout, s = "hi!!!!\n"
loc c = 33 '!', iter = core::str::iter::Chars {iter: core::slice::iter::Iter<u8> {ptr: core::ptr::non_null::NonNull<u8> {po…
────────────────────────────────────────────────────────────────────────────────────────────────────────────────────────────────────────────────────────────────────────────
>>> info locals
c = 33 '!'
iter = core::str::iter::Chars {
iter: core::slice::iter::Iter<u8> {
ptr: core::ptr::non_null::NonNull<u8> {
pointer: 0x80202003
},
end_or_len: 0x80202007,
_marker: core::marker::PhantomData<&u8>
}
}
info locals 会打印出当前作用域的局部变量。可以注意到,rust-gdb 很好地显示了结构体内部的情况。
程序调试命令
GDB 的调试命令中,比较常用的有:
| 命令 | 说明 |
|---|---|
si | 运行下个指令;si n 往下运行 n 个指令 |
n | 运行下一行;这是源码里的下一行,尤其是,不会进入函数调用 |
finish | 执行到当前帧栈返回;也就是运行到当前函数结束 |
b xxx | 设置断点;上面介绍 info functions 时,给了四种等价的方式给一个函数打断点 |
c | 运行到下一个断点 |
delete breakpoints | 删除所有断点;通常结合 info breakpoints 查看断点 id, delete breakpoints id 删除指定断点 |
start | 运行程序到程序入口(即 Rust 的 main 函数) |
q | 退出 GDB(或者两次 Ctrl-d) |
help | help 任何命令或者子命令 查看说明 |